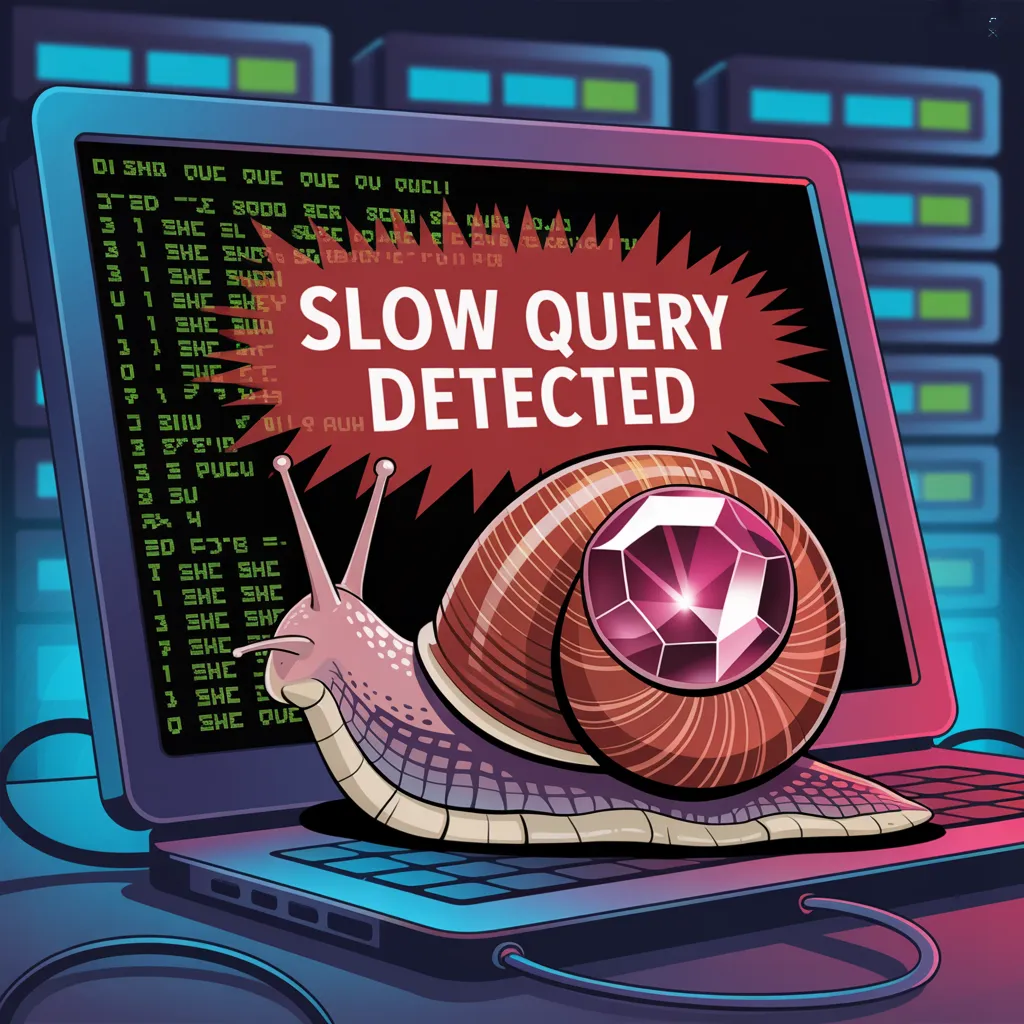
How to track and log slow queries in Ruby on Rails applications?

Ensuring application performance is one of our primary tasks. Slow database queries are a common cause of performance issues. In production, under heavy load, detecting such queries is like putting out fires. Fortunately, Ruby on Rails gives us tools to proactively catch such problems already at the development stage. In this article, I will show you how to implement a mechanism that will log slow SQL queries directly in your console.
Why is it worth monitoring queries locally?
Before we jump into the code, let's take a moment to reflect. Locally, we usually work with a small amount of data. A query that runs in the blink of an eye on our computer can grind to a halt indefinitely on a production database with millions of records. Early detection of such bottlenecks saves a lot of time and nerves. Instead of fighting problems in production, we optimize the code on the fly. It's a bit like having a personal performance assistant who whispers in your ear when something starts to slow down.
The magic of ActiveSupport::Notifications
The secret ingredient of our solution is ActiveSupport::Notifications. It is a powerful, though often underrated, mechanism built into Rails. It allows you to subscribe to various events within the framework. One of them is sql.active_record, called every time ActiveRecord sends a query to the database.
We will create a subscriber that listens for this event, measures its execution time, and, if it exceeds a set threshold, notifies us in the console.
Implementing our performance guard
The following code snippet is all you need. It is best to place it in a new file in the config/initializers/ directory, for example config/initializers/slow_query_logger.rb. This will ensure that it loads automatically when the application starts.
if Rails.env.local?
  class SlowQuerySubscriber < ActiveSupport::Subscriber
    SECONDS_THRESHOLD = 1.0

    ActiveSupport::Notifications.subscribe("sql.active_record") do |name, start, finish, id, data|
      duration = (finish - start) # Convert to milliseconds

      if duration > SECONDS_THRESHOLD
        duration = (duration * 1000).round(2) # Convert to milliseconds and round
        Rails.logger.debug "\e[31m# SLOW QUERY DETECTED: [#{name}] #{duration}ms #{data[:sql]}\e[0m"
      end
    end
  end
end
Let's see what exactly is going on here. We enclose the whole thing in the condition if Rails.env.local? to make sure that our mechanism only works locally. Then we define the constant SECONDS_THRESHOLD, which determines after how long we consider a query to be slow. In our case, it is one second.
The heart of the solution is subscribe(“sql.active_record”). We pass a block to it that takes several arguments – the most important ones for us are start and finish (start and end times) and data (a hash with the SQL query content). We calculate the duration and if it exceeds the threshold, we log a clear message in the console, highlighted in red so that it immediately catches the eye.
Summary
With this simple piece of code, you gain a tool to proactively take care of the performance of your Rails application. Any query that exceeds the defined threshold will be immediately flagged in the developer console. This allows for quick response, query analysis (for example, using EXPLAIN) and optimization before it becomes a real problem in production. Start using this technique today, and your application and its users will surely thank you.
Happy alerting!