The challenge of measuring developer productivity- the SPACE framework
Everyone wants to know if their team is productive - you would want to know that too. But what does “productive” actually mean? For a long time, organizations have been chasing a single, easy-to-track metric, hoping it would provide a simple answer. Perhaps they looked at the number of lines of code written, the number of meetings, the number of PRDs written, projects, the number of commits, or the number of merged pull requests. However, relying on a single metric is a dangerous trap. It can create misleading incentives, fail to capture the full scope of a team's work, and ultimately hinder real progress.
The reality is that productivity is a complex, multifaceted concept that cannot be reduced to a single number. To get a truly accurate picture, you need a holistic approach that takes several key dimensions into account. A better way to think about this is a framework that helps you choose the right metrics for your specific context.
Don't use a single metric
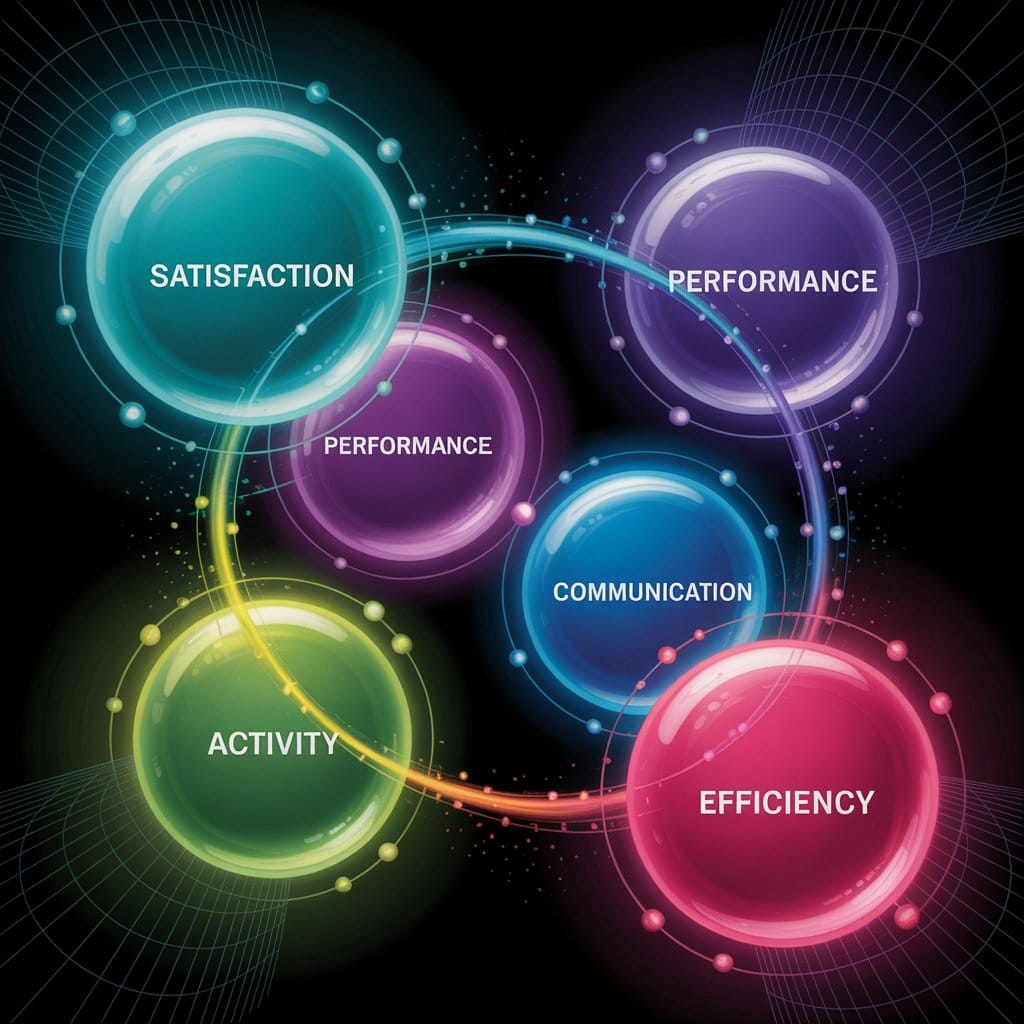
We can use the SPACE framework, which divides it into five key areas. By looking at their combination, you can go beyond superficial data and gain a deeper understanding of the team's condition and effectiveness.
S - Satisfaction and wellbeing
Team morale and satisfaction are directly linked to its performance. If developers are frustrated with their tools, overwhelmed by endless meetings, or feel disconnected from the team, their work will suffer. Measuring things like developer satisfaction, burnout, and engagement can provide powerful insights into the environment and tools that either help or hinder the team. Most popular tools for that are: anonymized surveys, 1-1s, burnout rates, and sick leave usage
P - Performance
This dimension focuses on work results. It is not just about how much work is done, but about its quality. Metrics in this area may include the number of errors found in production, customer satisfaction rates, or service reliability. This helps to ensure that the work performed creates real value and is of a high standard. You can check it by looking at the customer satisfaction rate, NPS, customer support tickets, code quality, and reliability.
A - Activity
Here, we measure the “number” of things. This includes activities such as code reviews, test runs, or the number of deployments. While these metrics can be useful, they should never be viewed in isolation. They are most valuable when used to diagnose a problem or understand a specific workflow, rather than as an end in themselves. For example, a low number of code reviews may indicate a lack of collaboration. This can be measured by checking the number of pull requests, deployment frequency, commit frequency, etc.
C - Communication and collaboration
Effective teamwork is at the heart of every successful engineering team. This dimension analyzes how well people work together. This may include measuring the cost of coordinating work between different teams or assessing how easily new team members can get up to speed with the code base. These metrics can reveal bottlenecks and indicate areas where better collaboration is needed. This can be mesuared by checking the number of meetings, messages on Teams or Slack, post-mortem, retros, etc.
E - Efficiency and flow
This area focuses on the time it takes to complete work. It's about how smoothly and quickly a developer can move from idea to production deployment. This includes metrics such as lead time, the time it takes to complete a task, or the number of handoffs required to implement a change. This is the hardest dimension to measure, as it requires a lot of context and knowledge. Overall, we can have some surveys about context switching, bottlenecks in processes, measure time from project start to the end of the project, etc.
Summary
This multidimensional framework is not a one-size-fits-all solution; it is a guide. While there are general industry benchmarks that can give you a general “snapshot” of your organization's health, this framework is a more powerful tool for deep, contextual measurement. It is designed to help you ask and answer specific questions, such as: “Has our investment in automated testing actually improved our workflow?” You can then select a few relevant metrics from different categories within the framework to get a comprehensive answer.
By taking this approach, you can move away from chasing a single vanity metric and adopt a more experimental mindset. Instead of making changes blindly, you can formulate a hypothesis, measure the variables that matter, and truly understand the results of your efforts. This leads to meaningful improvements that not only make the team more effective but also create a healthier and more satisfying work environment for everyone.
Happy SPACE-ing!